Analysis of Template and Scenario Results
All metrics for analyzing results are located in the corresponding section of the menu, within a specific scenario or template. The metrics section can be found under the name of the opened scenario or template, in the "Metrics" item.
-
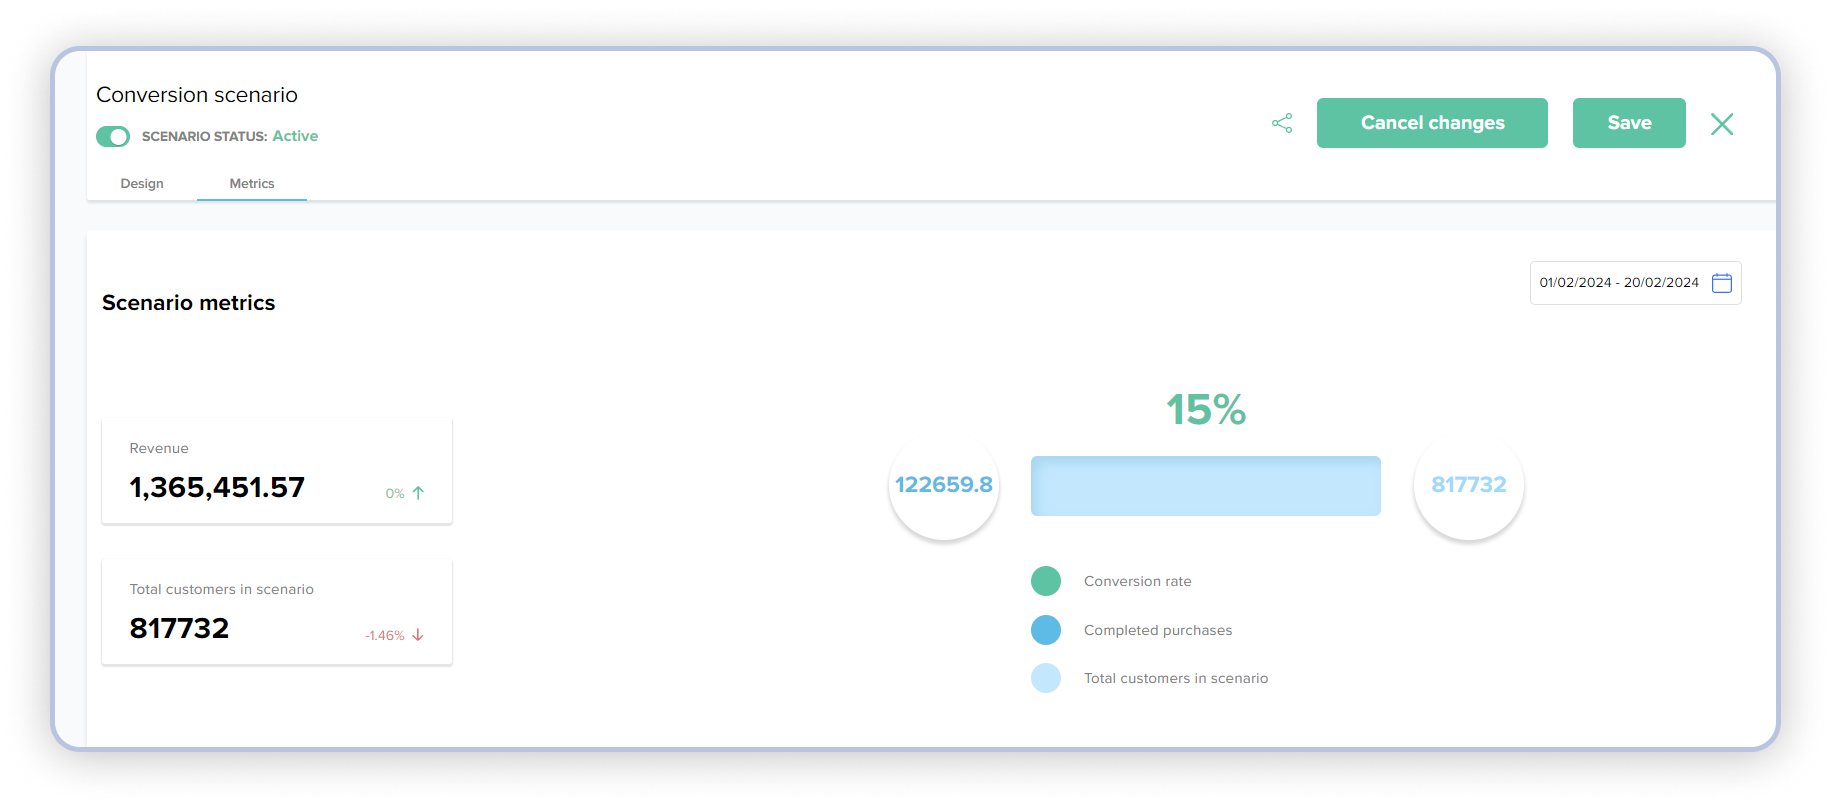
Scenario metrics:
- Revenue - total revenue from a specific scenario
- Total clients in the scenario - the number of clients engaged in a specific scenario
- Conversion rate - the percentage of conversion from all clients engaged in the scenario
- Made a purchase - the number of clients who made a purchase based on this scenario
-
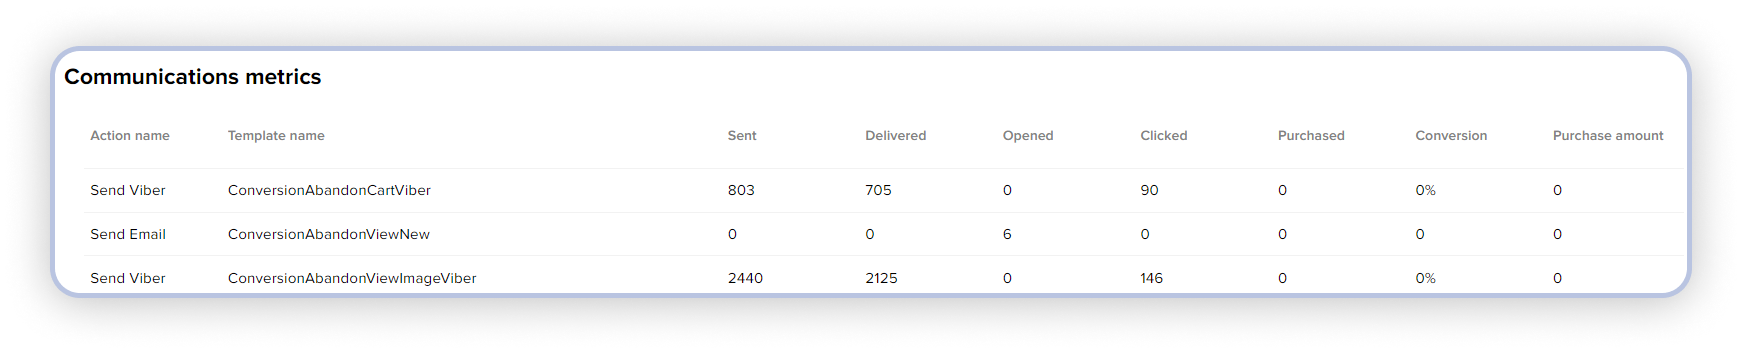
Communication metrics:
- Event name - communication event. For example, "Send Mob Push" - if communication occurs via push notification in the mobile app, "Send Email" - if communication is through email, "Send SMS" - if communication is through SMS, and so on.
- Template name - the template that was used in our scenario.
- Sent - the number of clients to whom the communication was actually sent.
- Delivered - the number of clients to whom the communication was actually delivered.
- Opened - the number of clients to whom the communication was delivered and who opened it (for example, opened the email, read the SMS message, etc.).
- Clicked - the number of clients who opened the communication and clicked through it to your store (for example, through the "Buy" button link).
- Conversion - the conversion percentage of clients to whom the communication was sent (item Sent).
- Messages sent - the total number of messages sent for a specific template.
- Messages delivered - the number of messages successfully delivered for this template.
- Messages opened - the number of messages that were opened by users after being delivered to them.
- Clients clicked - the number of clients who opened the message and clicked on it (for example, through the "Buy" button link).
- Purchases made - the number of clients who opened the message, clicked on it, and successfully completed a purchase.
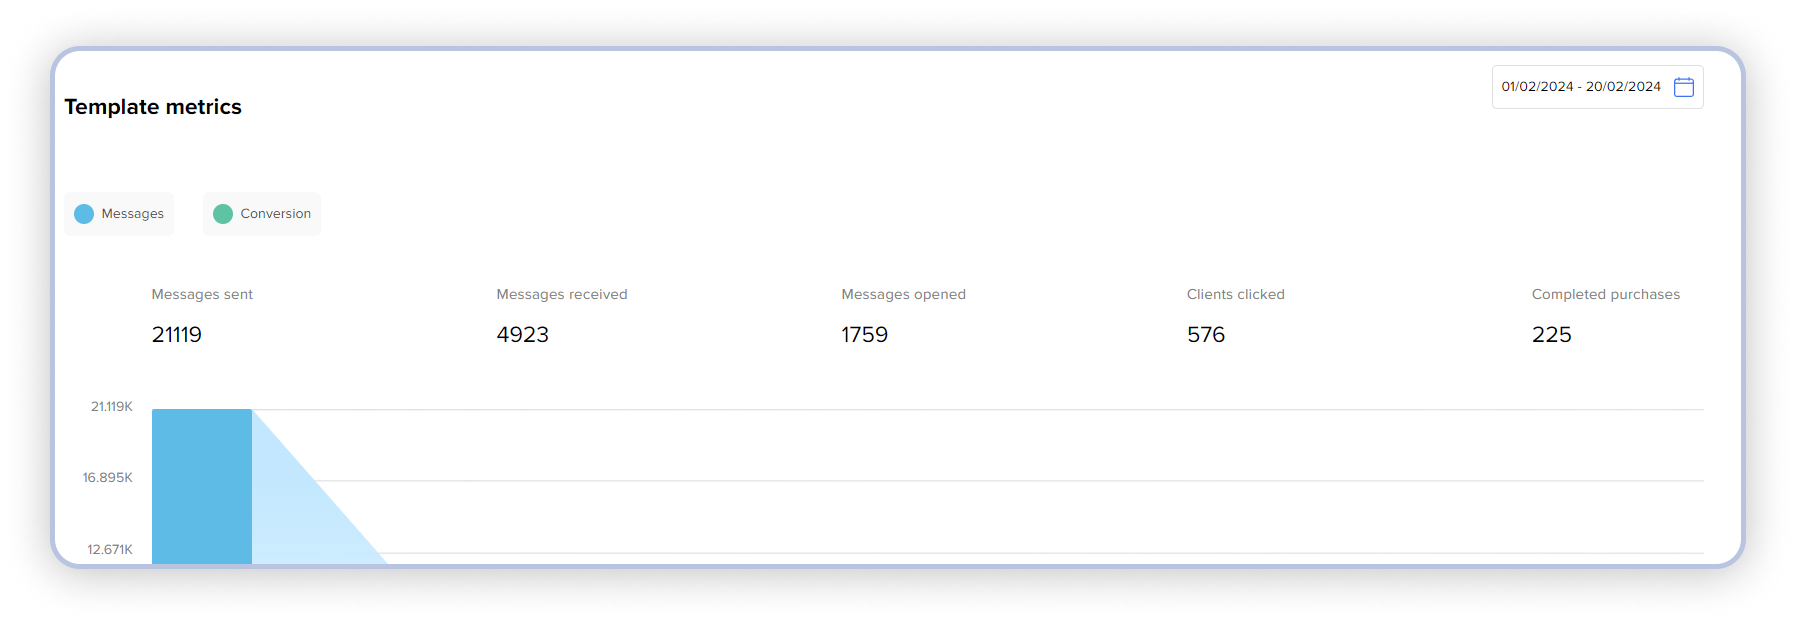
Under both template and scenario metrics, visual graphs are available for better informativeness. You can hover over the desired graph and get detailed information about how many clients entered the scenario on a specific day, how many clients from the scenario made a purchase on that day, or what revenue you received for a specific day.
Also, for your convenience, you can filter the information for a specific period and view the metrics. You can do this by clicking on the calendar icon in the top right corner of the metrics, specifying the period for which you want to view the metrics.